
States play a significant role in the construction and maintenance of the country’s roadway system. Each state employs its own approach and objectives when planning and constructing highway infrastructure, including addressing obstacles and environments unique to that state. A newly updated report by the Midwest Economic Policy Institute explores the highway construction costs for each state and more closely examines them throughout the Midwest.
Full Report: A Comparison of Highway Construction Costs in the Midwest and Nationally
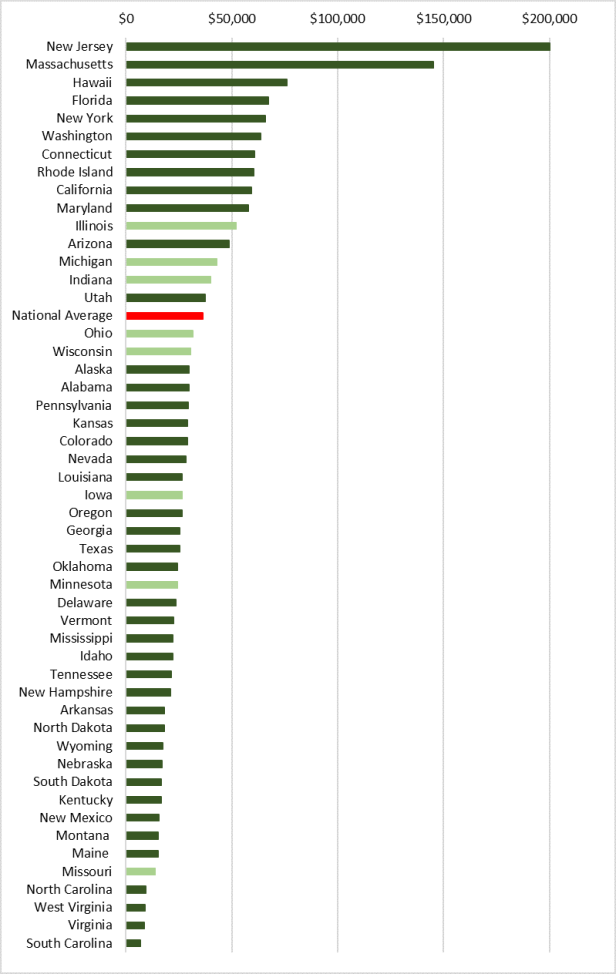
The figure below summarizes each state’s highway construction, right-of-way (ROW) acquisition, and engineering costs per lane mile. This analysis provides an illustration of how construction costs compare between states; however, as stated above, each state encounters its own unique complications that factor into overall costs. Therefore, it cannot be exclusively used as a definition of cost effectiveness.
It is important to note that the cost per lane mile measurement used throughout the report does not represent the cost to build a newly constructed lane mile. The figure simply averages the total construction, ROW, and engineering costs for state administered roadways, respectively, expended each year between 1993 and 2015 by the total number of state administered lane miles that exist in the state during each year. In essence, it provides a normalization of construction costs to facilitate a comparison.

Specifically, a state’s geography, population density, and design requirements all impact construction costs. A state with higher overall population density and more urban areas will have higher overall costs due to more stringent design standards on urban roadways, added complicated intersections such as expansive overpasses, and complex work zones during construction. See the complete report for a more thorough comparison of construction costs to density, urban roadways, and infrastructure in each state.
In comparison to the nation, the eight Midwestern states (Illinois, Indiana, Iowa, Michigan, Minnesota, Missouri, Ohio, and Wisconsin) fall within the middle range of highway construction costs per lane mile, with only three ranking above the national average (Figure 4). As previously described, the Midwest’s flat landscape and moderate population density likely contribute to overall lower costs; specifically, Iowa, Minnesota, and and Missouri represent the lowest cost states in the Midwest, with Missouri ranking among the lowest cost states in the nation.
Furthermore, labor factors into project costs, yet higher wages do not consistently equate to higher construction costs in the Midwest. As shown below, across the Midwest, road construction worker wages are generally higher per hour than the national average. As an example, compared to the national average, construction workers in Wisconsin are paid higher wages per hour. Operating engineers in Wisconsin earn 14 percent more than the national average and highway maintenance workers in the state earn 7 percent more than the national average. Construction costs per lane mile, however, are 16 percent lower in Wisconsin than the national average. Similarly, road construction worker wages in Minnesota are 17 percent to 18 percent higher than the national average; yet construction disbursements per lane mile are 34 percent below the national average.
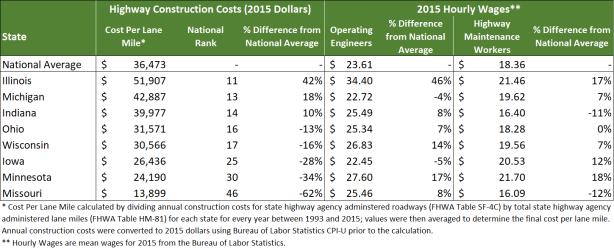
While two of the three states with higher construction costs do have higher than average wages, it is important to note that of the five Midwestern states with lower than average construction costs per lane mile, four have higher operating engineer wages, ranging from 7 to 17 percent above the national average. Consequently, it is clear that a state can have higher wages without higher construction costs. Overall, there is no clear evidence that higher wages lead to higher construction costs.
In conclusion, an assortment of variables factor into highway construction costs, including geography, population density, and design standards. Consequently, it is difficult to provide an exact comparison of construction costs between states due to these factors and each state’s needs; however, this report provides a foundation to understand construction spending throughout the nation.
**Please note that this report and corresponding blog post were recently updated to reflect different data for lane miles. The previous report mistakenly used total lane miles (including state administered and local roadways), however costs were only reflecting state administered construction, ROW, and PE costs. This version now correctly uses the only state administered lane miles. We at MEPI apologize for any confusion this may have caused.**
Want to read the entire report? Click here.
